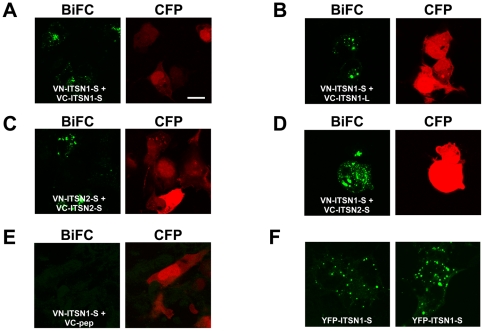
Figure 2. ITSNs form homo and heterodimers.
Bimolecular fluorescence complementation was used to assess the dimerization of ITSN1 and ITSN2 isoforms in COS cells. A–E. The BiFC emission from the reconstituted Venus fluorophore was pseudocolored green (left panel). CFP (pseudocolored red, right panel) was co-transfected to mark transfected cells and only CFP-positive cells were imaged BiFC. A. ITSN1-S forms homodimers. VN-ITSN1-S was co-expressed with VC-ITSN1-S. B. The short and long isoforms of ITSN1 form heterodimers. VN-ITSN1-S was co-expressed with VC-ITSN1-L. C. ITSN2-S forms homodimers. VN-ITSN2-S was co-expressed with VC-ITSN2-S. D. ITSN1 and ITSN2 heterodimerize. VN-ITSN1-S was co-expressed with VN-ITSN2-S. E. As a negative control for BiFC, VN-ITSN1-S was co-expressed with a non-specific peptide fused to VC (VC-pep). F. For comparison with the BiFC results, YFP-ITSN1-S was expressed in COS cells. Shown are two different panels of positive cells. The fluorescence patterns shown in all panels (A–F) are representative of localization observed throughout the plate. These results are representative of at least three independent experiments. Note: white scale bar represent 10? m.

