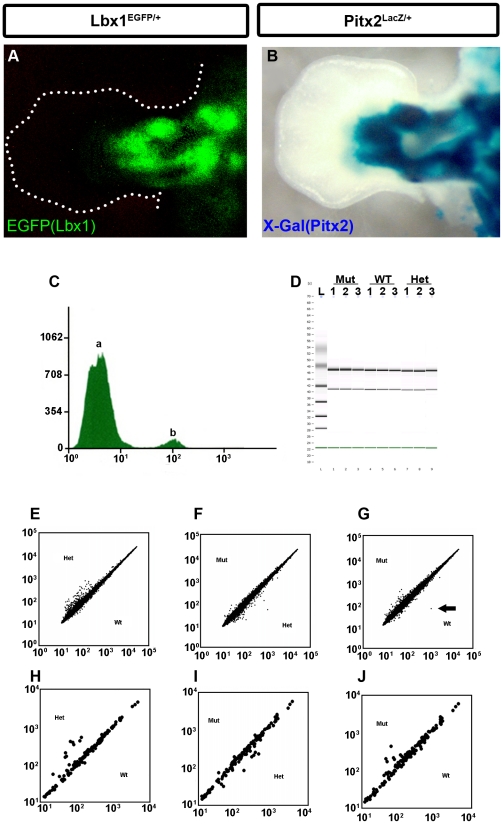
Figure 2. Flow-Sorting EGFP+ MMP Cells from Forelimbs.
(A) EGFP indicating Lbx1 expression in Lbx1EGFP/+ E12.5 mouse. (B) Immunohistochemistry of cross-sectioned Lbx1EGFP/+|Pitx2LacZ/+ E12.5 mouse forelimb. beta-Gal(Pitx2) and Lbx1(EGFP) are co-localized in the flexor and extensor muscle groups. (C) FACS analysis of sorted Lbx1EGFP/+ cells. The automated multiwell plating function on the MoFlo was used to test a variety of substrate and media at systematically controlled plating densities. Cells were sorted at a rate of 10,000 cells/sec with a purity of 95–99+%, depending on the stringency of gating. Cell number (Y axis, log scale) vs. florescence intensity (X axis, FL1) plot. The “a” peak represented EGFP− cell population, and the “b” peak represented the GFP+ cell population. The GFP+ population represents 5–7% of the total limb bud cellular pool. (D) RNA samples were quantified and ran on an Agilent Bioanalyser 2100 to assess RNA quality prior to microarray analysis. (E) Comparison of expression of total RNA from HET (y axis) vs. WT (y axis). Each dot in both axes represents relative RNA expression levels for an individual gene in WT vs. HET respectively. If a dot is perfectly located in the diagonal line, then the relative gene expression level for the representing gene exhibits no difference within HET and WT. (F) Comparison of expression of total RNA from MUT (y axis) vs. WT (x axis). Each dot in both axes represents relative RNA expression levels for an individual gene in MUT vs. WT respectively. (G) Comparison of expression of total RNA from MUT (y axis) vs. HET (x axis). Each dot in both axes represents relative RNA expression levels for an individual gene in MUT vs. HET respectively. Pitx2 expression levels were indicated by arrow. Pitx2 was strongly down regulated in the Pitx2 mutants. Comparison of expression of total RNA of genes from Table 1 of HET (y axis) vs. WT (x axis) (H), MUT (y axis) vs. WT (x axis) (I), MUT (y axis) vs. HET (x axis) (J).

