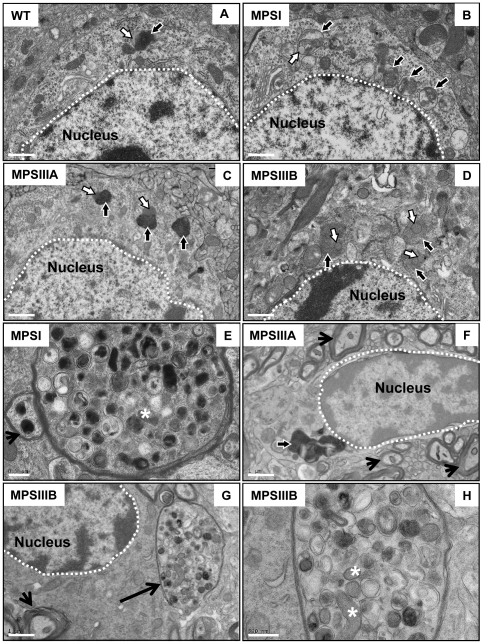
Figure 2. Transmission electron microscopic analysis of MPS brain showing an increase in lysosomal burden in MPS cerebral cortex and large dystrophic axons in MPSI and IIIB.
Images show an increase in lysosomal burden (black arrows outlined in white) in MPSI, IIIA and IIIB (B–D and F; Bars = 1 µm) compared to WT cerebral cortex (A; Bar = 1 µm). Lipid (white arrows outlined in black) is also stored in the lysosomes of MPS brain (B, C, and D) and also a small amount in WT (A). Dystrophic axons were observed in MPSI (E; Bar = 0.5 µm) and IIIB (arrow in G; Bar = 1 µm and enlarged in H; Bar = 0.5 µm) cerebral cortex but not in MPS IIIA (F; Bar = 1 µm). These structures contained organelles similar to immature and mature autophagosomes with electron dense material and some mitochondria (*; E and H). Normal axons were also observed in all MPS types (E, F and G; arrow heads).

