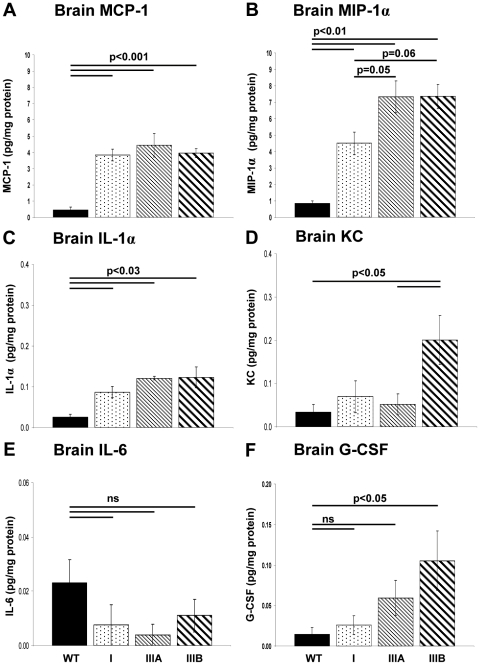
Figure 6. Elevated inflammatory cytokines in MPS at 9 months of age.
WT, MPSI, IIIA and IIIB mouse brains were analysed using cytometric bead array analysis to quantify a set of inflammatory cytokines isolated from whole extracts to further quantify the level of neuroinflammation in MPS (A) MCP-1, (B) MIP-1α (C) IL-1α, (D), KC (E) IL-6 and (F) G-CSF. IFNγ, IL-1β, IL-3, IL -9, IL-13 and GM-CSF were below the level of detection using this assay. n = 5–6 mice per group, error bars represent the SEM and p values are from one way ANOVA with Tukey's multiple comparisons test.

