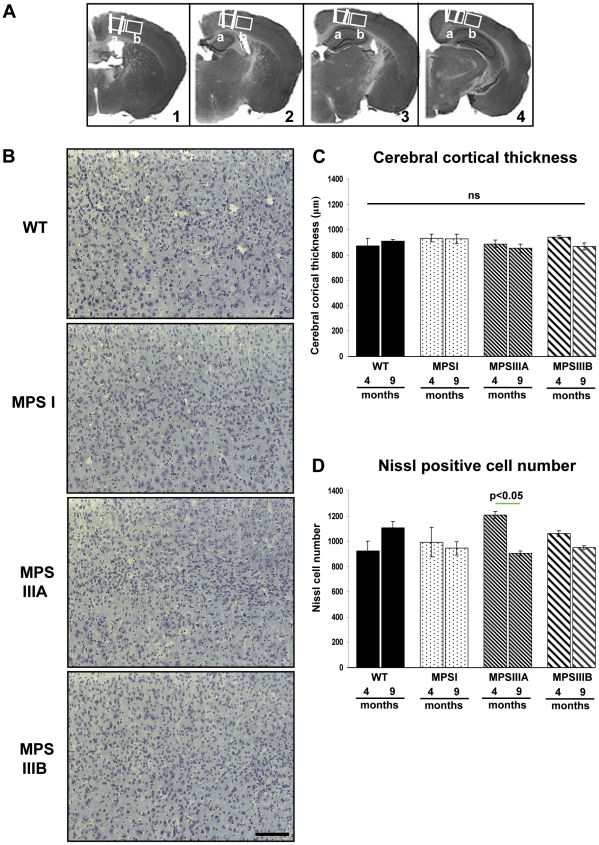
Figure 7. No significant changes in the cortical thickness or Nissl positive cell number.
(A) Cerebral cortical thickness was measured from the apex of the cingulum of the corpus callosum to the outside of cerebral cortical layer II. A second measurement was taken 1000 µm laterally from the apex of the cingulum, from the corpus callosum to the outside of cerebral cortical layer II. These measurements (white lines in A) were taken from four sections of brain (Bregma 0.26, −0.46 −1.18 and −1.94 mm) and analysed (C). Four sections of brain (Bregma 0.26, −0.46 −1.18 and −1.94 mm) were stained for Nissl substance (B) and two low power fields of view, covering cortical layers II/III–VI (boxed areas in A), were captured from each section and the number of Nissl positive cells were counted using ImageJ (D). n = 3 mice per group, error bars represent the SEM and p values are from two way ANOVA with Tukey's multiple comparisons test. Significant individual genotype*time differences are shown by a thin green line. Bar = 100 µm.

