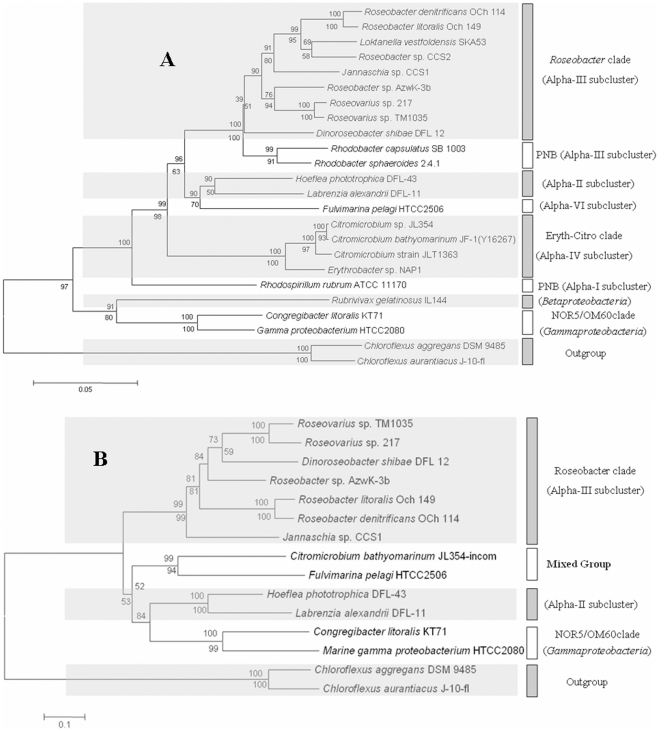
Figure 1. Neighbor joining phylogenetic analysis of 16S rRNA gene sequences from all whole genome-sequenced marine AAP bacteria.
(A). Scale bar represents 5% nucleotide substitution percentage. Neighbor joining tree of pufC gene sequences from all whole genome-sequenced marine AAP bacterial (B). Scale bar represents 10% nucleotide substitution percentage. Bootstrap percentages (≥50%) from both neighbor joining (above) and maximum parsimony (below) are shown.

