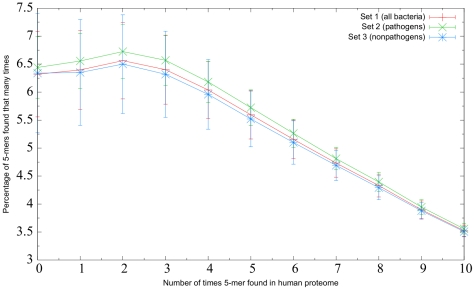
Figure 2. Pathogenic versus nonpathogenic bacteria.
Relative similarity to the human proteome of the bacteria in set 1 (all bacteria sequenced to date), set 2 (20 pathogenic bacteria), and set 3 (14 nonpathogenic bacteria). Each point  indicates that, on average, y% of the 5-mers in the proteomes in that set were found x times in the human proteome. Because only rare 5-mers are of interest in this study, bacterial 5-mers that were found more than ten times in the human proteome are not represented. The length in one direction of the error bar associated with each point represents the standard deviation of the measurements that were averaged to calculate that point.

