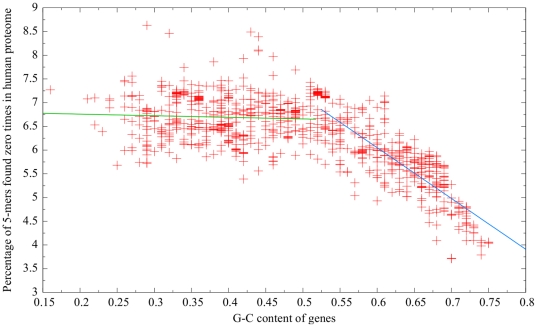
Figure 6. Relationship between G-C content and percentage of 5-mers absent from the human proteome.
As the plot exhibits two distinct regions, two best-fit lines were calculated. The green best-fit line was calculated using points with G-C contents less than 0.52 and had an  value less than 0.01, whereas the blue best-fit line was calculated using points with G-C contents greater than or equal to 0.52 and had an
  value of 0.74.

