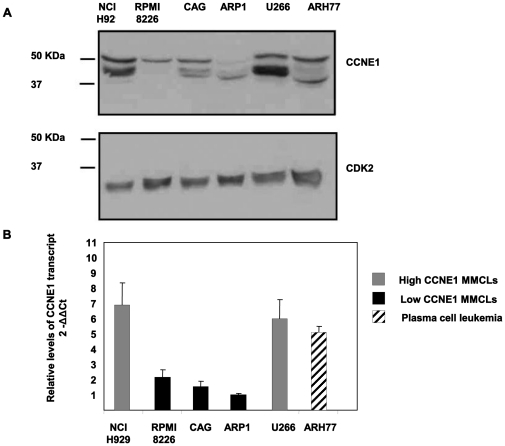
Figure 1. CCNE1 expression profile in hMMCLS.
(A) Various multiple myeloma cell lines (NCI H929, RPMI8226, CAG, ARP1 and U266) and plasma cell leukemia cell line ARH77 in logarithmic growth phase were extracted and subjected to immunoblotting, utilizing CCNE1 antibodies. CDK2 expression served as an internal loading control. (B) Various multiple myeloma cell lines (NCI H929, RPMI8226, CAG, ARP1 and U266) and plasma cell leukemia cell line ARH77 in logarithmic growth phase were extracted and subjected to qRT-PCR in quadruplicates. Data are represented as mean±standard deviation of the ratio of CCNE1 and GAPDH between all hMMCLs and ARP1. (A–B) Experiments were performed at least 3 times and one representative result is presented.

