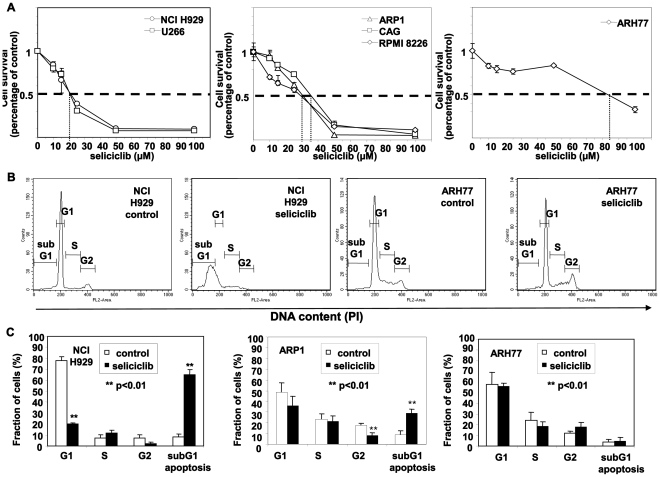
Figure 2. Heterogenous resistancy to seliciclib in hMMCLs.
(A) The indicated hMMCLs were incubated in the absence or presence of increasing concentrations of seliciclib for 3 days. Cell viability was determined by MTT assay. Data are represented as mean±standard deviation. Experiments were performed at least 3 times and one representative result is presented. Seliciclib resulted in a decrease in cell viability with an IC50 ranging from 25 to 90 µM. (B) Cell cycle analysis by PI staining was performed on hMMCLs incubated in the absence or presence of 50 µM seliciclib for 12 hours. Cells were collected, fixed, stained with propidium iodide (PI) and analyzed by flow cytometry. DNA distribution in the cells is presented. (C) Quantification of cell cycle stage analysis of control and seliciclib-treated (50 µM, 12 hours culture) hMMCLs. Analysis of representative lines of highly sensitive (NCI H929), a moderately-sensitive (ARP1) and a resistant (ARH77) lines are displayed. The subdyploid DNA peak (subG1) represents apoptotic cell fraction. Data are represented as mean±standard deviation of 3 different experiments. Probability values of t-test are presented **p<0.01.

