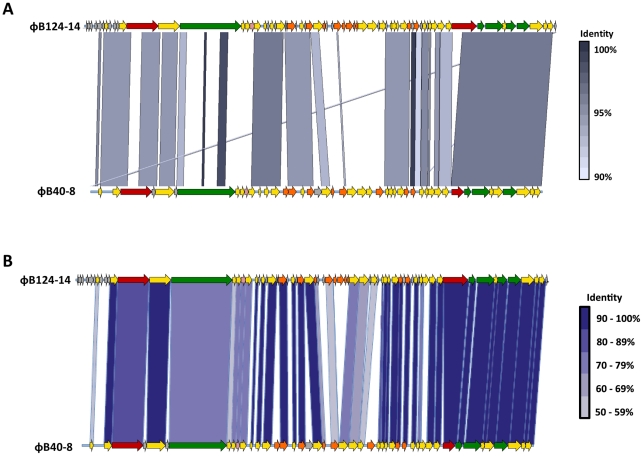
Figure 5. Comparative genomic analysis of ΦB124-14 and ΦB40-8 (ATCC 51477-B1).
A. Nucleotide sequences of φB124-14 and φB40-8 were compared using the Artemis Comparison Tool (ACT). Shaded areas between linear phage genome maps represent areas of high nucleotide identity (90% or greater). Colour scale represents level of nucleotide identity at each region of homology. The ORF map for φB40-8 corresponds to the annotations available in the GenBank submission (FJ008913.1). For the purposes of this analysis, the φB124-14 genome was linearised between ORFs 29 and 30 (Figure 2, Table S2), in order to compare the circular φB124-14 genome with that of φB40-8. Colours of ORFs correspond to functional assignments as used in Figure 2. B. Comparison of amino acid sequences from φB124-14 ORFs with those annotated in the φB40-8 genome. Shading between arrows indicates those sharing high amino acid sequence identity. Colour scale indicates level of amino acid identity between each homologous ORF.

