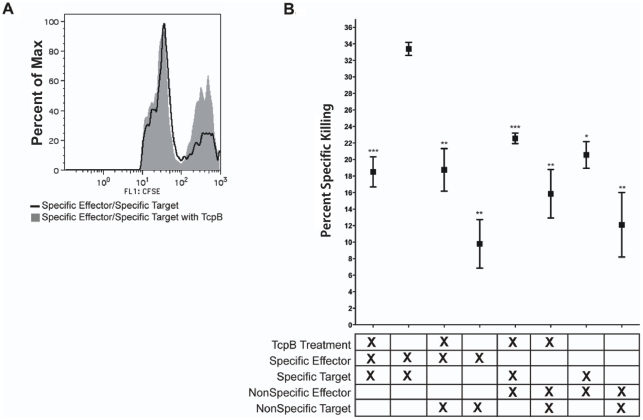
Figure 1. The affect of TcpB on CD8+ T cell specific killing.
A) Representative histogram of specific killing after an in vivo killing assay with TcpB or maltose binding protein treatment of target cells. Epitope specific peak stained CFSEhi is protected after TcpB treatment of target cells. B) The percent specific killing determined after an overnight incubation of target cells with TcpB or maltose binding protein and then pulsed with Brucella melitensis specific epitope. The X in each column on the x-axis indicates the presence of treatment, type of effectors, or target cells in each row. ***p<0.001, **p<0.01, *p<0.05.

