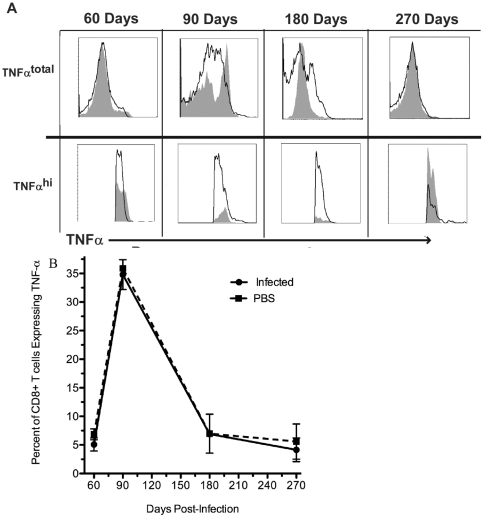
Figure 7. CD8+ T cell TNF-α expression.
A) Histograms of TNF-α staining over time. Note the top row shows the total TNF-α expression while the bottom row examines the subtle differences of TNF-α hi expression between uninfected and infected mice. The black line represents splenocytes from infected mouse pulsed with B. melitensis specific peptide. The shaded grey region represents splenocytes from an uninfected age-matched mouse pulsed with B. melitensis specific peptide. B) Percent of CD8+ T cells expressing TNF-α in infected and non-infected mice.

