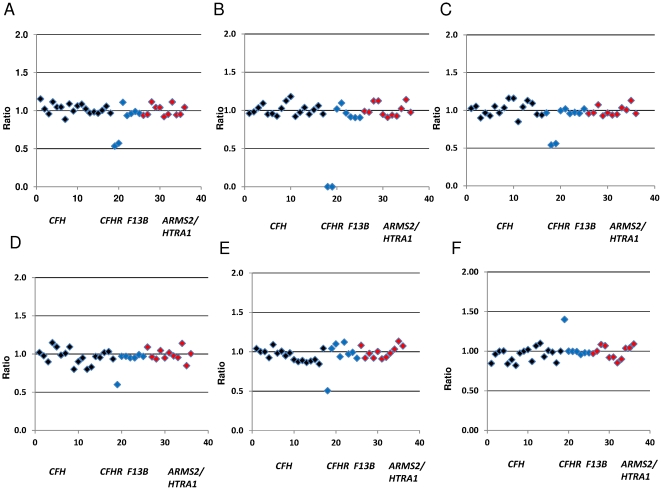
Figure 2. Peak Patterns and Scatter Plots.
Scatter plots representing 5 different CNV re-arrangements detected in the CFHR3, CFHR1 and CFHR4 genes in our sample cohort. Probes targeting the CFH gene are represented in black, probes targeting the CFHR1-5 and F13B genes are represented in blue and probes corresponding to the ARMS2 and HTRA1 genes are represented in red. The x axis describes each probe number which corresponds to the numbered probe list in Table S1. The y axis represents normalized probe ratios relative to a two copy locus (Normal range 0.75–1.25). The scatter plots describe (A) a heterozygous deletion of CFHR3-1, (B) a homozygous deletion of CFHR3-1, (C) a heterozygous deletion of CFHR1-4, (D) a heterozygous deletion of CFHR3, (E) heterozygous deletion of CFHR1 (F) heterozygous duplication of CFHR1.

