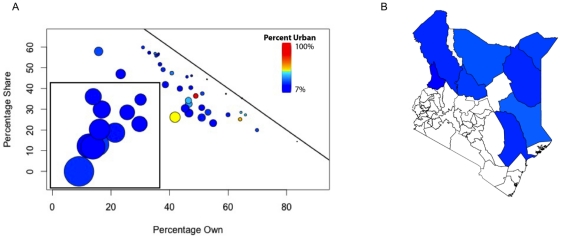
Figure 5. The relationship between mobile phone ownership and sharing.
A) The relationship between mobile phone ownership and sharing behavior, by county. Circles are colored by percentage of the population of the country considered urban (see main text), and their size represents the percentage of individuals in a county that doesn't use a mobile phone at all. B) Map showing the counties where less than 30% of individuals own and less than 30% of individuals share a phone. The colors correspond to 3A, representing the percentage of the population considered urban.

