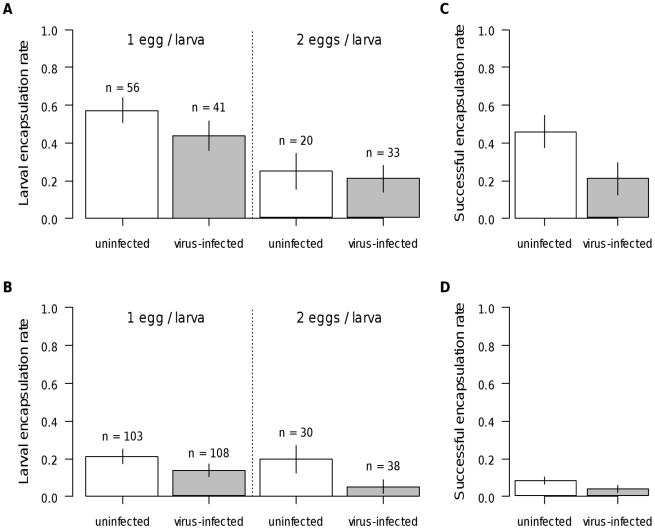
Figure 4. Encapsulation rates in cured DSR flies in experiment 2.
Top: experiment 2.1 (low larval density). Bottom: experiment 2.2 (high larval density). (A & B) Larval encapsulation rate. (C & D) Successful encapsulation rate with “n” giving the number of dissected larvae. White and grey: virus-free and virus-infected parasitoids respectively. Bars are standard errors.

