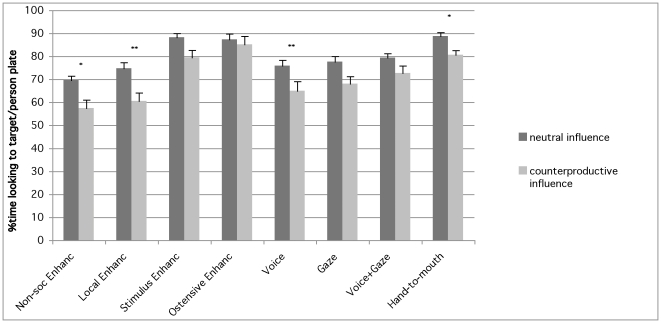
Figure 3. Looking index.
Mean (and SEM) durations (in percentage) of looking to the target/experimenter plate in the neutral choice and counterproductive influence condition for each group (significant differences are shown for within group comparison *P<0.05, **P<0.01; see Tables 1 and 2 for between group results).

