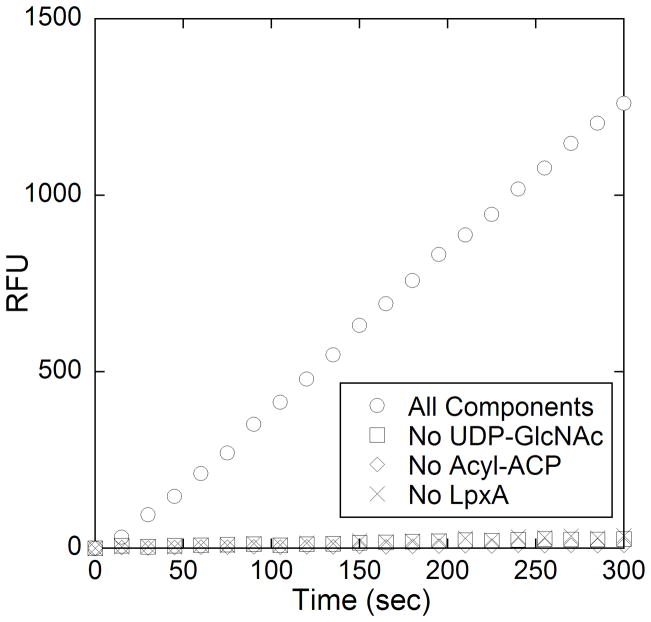
Figure 3.
Reaction progress curves of the complete LpxA reaction (○), and control reactions without either nucleotide (□), acyl-ACP (◇), or acyltransferase (x). The complete LpxA assay mixture contained 20 mM HEPES (pH 8), 40 μM R-3-hydroxymyristoly-ACP, 4 mM UDP-GlcNAc, 10 μM ThioGlo, and 10 nM LpxA (added 5 minutes after ThioGlo) in a final volume of 100 μL. The reaction was incubated at 25 °C and its progress was monitored continuously at λex = 379 nm and λem = 513 nm for 10 min at 15 s intervals. Control reactions were run in similar fashion with the omission of substrate or enzyme, as indicated.

