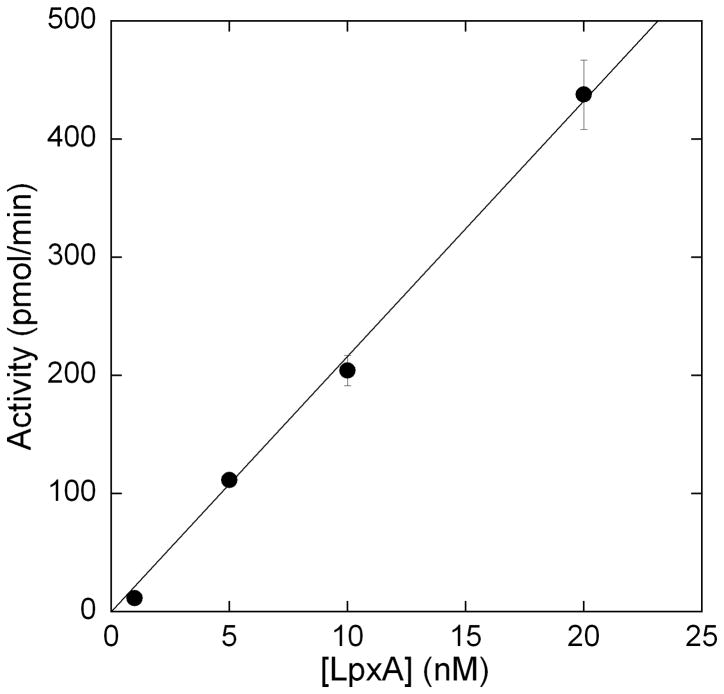
Figure 4.
Linear dependence of initial reaction velocity with varying LpxA concentrations using the ThioGlo coupled fluorescence assay. The assays were run as described under Figure 3 caption, with varying amounts of LpxA being added. The assay showed a linear relationship between activity and enzyme concentration up to 20 nM LpxA.

