
Figure 4. Functional and anti-tumor activities of super-2 in vivo.
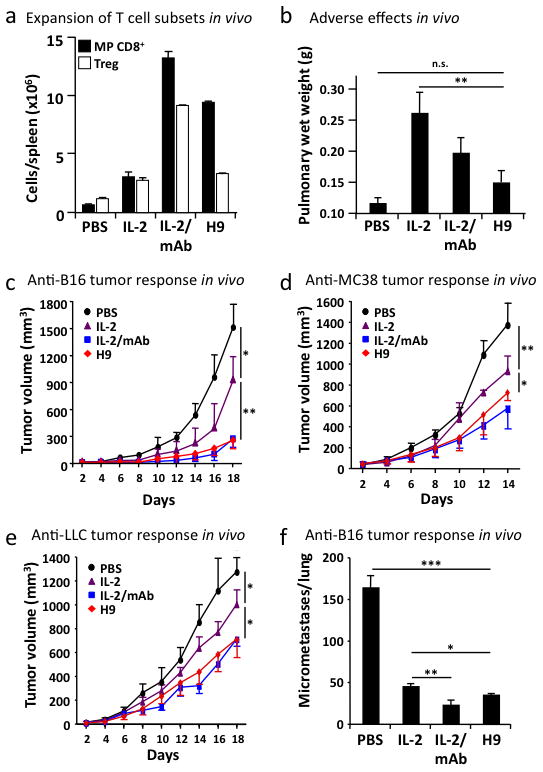
a, Total cell counts of host CD3+ CD8+ CD44high memory-phenotype T cells (MP CD8+, closed bars), and host CD3+ CD4+ CD25high T cells (Treg, open bars) was determined in the spleens of mice receiving either PBS, 20 μg IL-2, 1.5 μg IL-2/anti-IL-2 mAb complexes (IL-2/mAb), or 20 μg H9 (see also Supplementary Fig. 14). b, Pulmonary edema (pulmonary wet weight) served to assess adverse toxic effects following IL-2 treatment, and was determined by weighing lungs before and after drying. c–f, C57BL/6 mice (n=3–4 mice/group) were injected either subcutaneously with 106 B16F10 melanoma cells (B16, c), 2.5× 10⁶ murine colon carcinoma 38 (MC38, d), 106 Lewis lung carcinoma (LLC, e), or mice received 3× 10⁵ B16F10 melanoma cells intravenously (B16, f), followed by daily injections of either PBS, 20 μg IL-2, 1.5 μg IL-2/mAb complexes, or 20 μg H9 for five days once subcutaneous tumor nodules became visible and palpable or from day three on for intravenously-injected tumors (see also Supplementary Fig. 15). Shown is mean tumor volume in mm3 (+/− SD) vs. time upon tumor inoculation. Error bars represent SEM. P values refer to comparisons of WT with the other treatment modalities. *, p<0.05; **, p<0.01; ***, p<0.001.