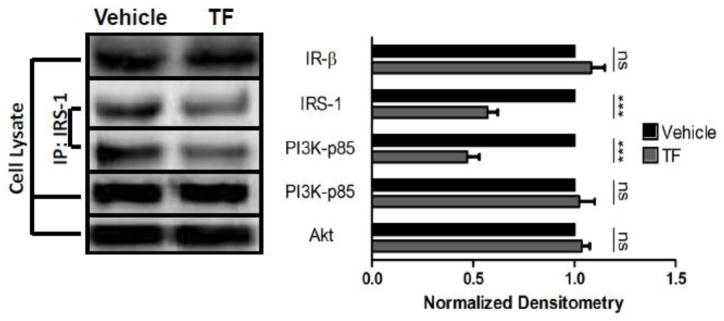
Figure 4.
Mechanism of TF-induced insulin resistance. Perigonadal fat from male C57/BL6 mice was treated as in Figure 1. Levels of IR-β, PI3K, and total Akt were measured in cell lysates, while IRS-1 and IRS-1-associated PI3K were assessed after immunoprecipitation. Representative immunoblots are shown (Left) as well as cumulative densitometry for each protein as means ± S.E.M. normalized to vehicle-treated controls (n = 4–6). IRS-1 densitometry is represented by IRS-1/Akt and IP PI3K-p85 densitometry is represented by IP PI3K-P85/supernatant PI3K-P85, each independently normalized to EtOH. *** p < 0.001.

