Figure.
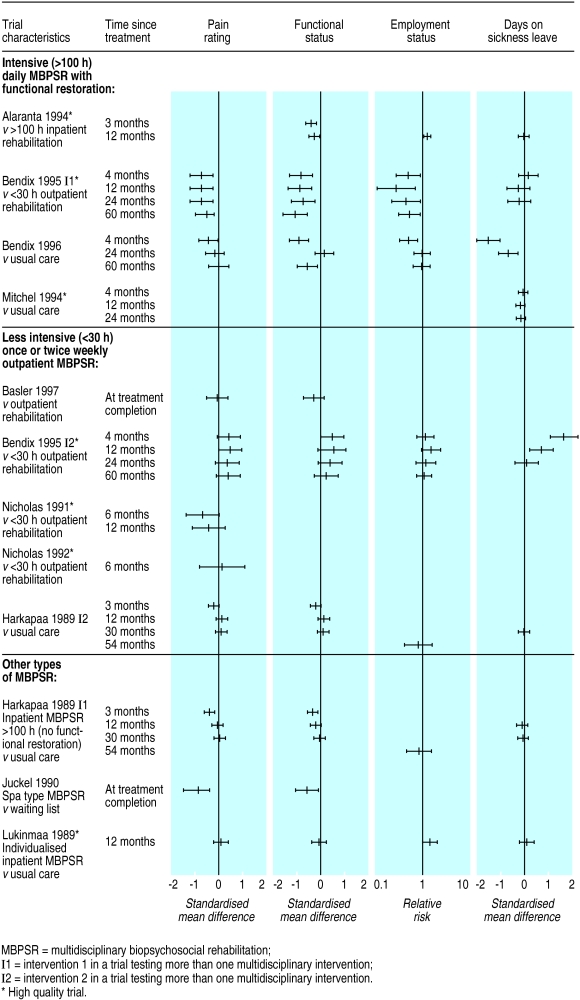
Treatment effect sizes for 12 randomised comparisons of multidisciplinary biopsychosocial rehabilitation and a control condition. Bars represent standardised mean differences and 95% confidence intervals for comparison of intervention and control groups, except for employment status where bars represent relative risks. Treatment effect sizes entirely to the left of the vertical line indicate statistically significant differences in favour of the intervention

