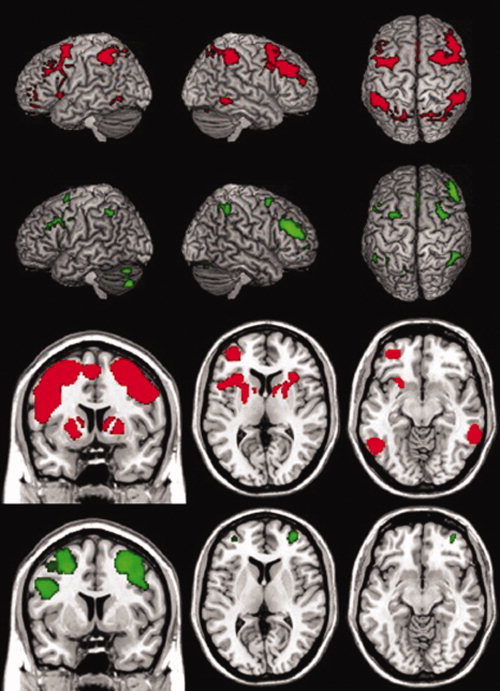
Figure 1.

Task‐dependent BOLD activation in OTCD patients and healthy controls. Statistical parametric maps of one‐way within‐group t‐tests for the Control group (red) and OTCD group (green) for 2‐back greater than 1‐back task‐related BOLD signal change (FWE P < 0.01). Bottom two rows, left to right, show coronal slice at y = 7, axial slices at z = 7, and z = −10. The position of right and left hemispheres are as they appear.
