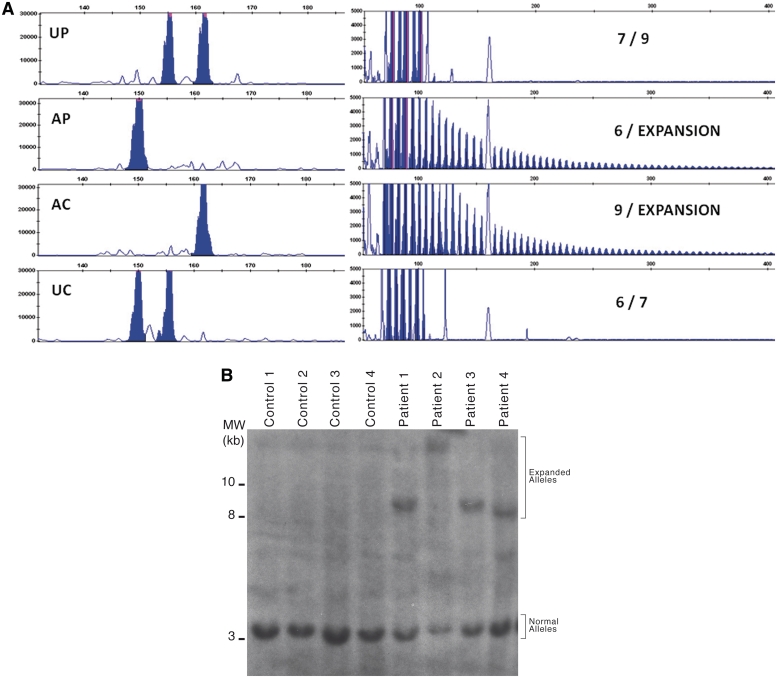
Figure 2.
Mutation analysis in patients with SCA36. (A) PCR amplification of the (GGCCTG)n in a nuclear family showing the lack of transmission of a normal size allele from the affected parent to the affected child, as well as a repeat expansion pattern in both by TP-PCR. AC = affected child; AP = affected parent; UC = unaffected child; UP = unaffected parent. Genotypes are indicated on the right end of each panel. (B) Southern blot analysis of four unaffected (left) and four affected subjects (right).

