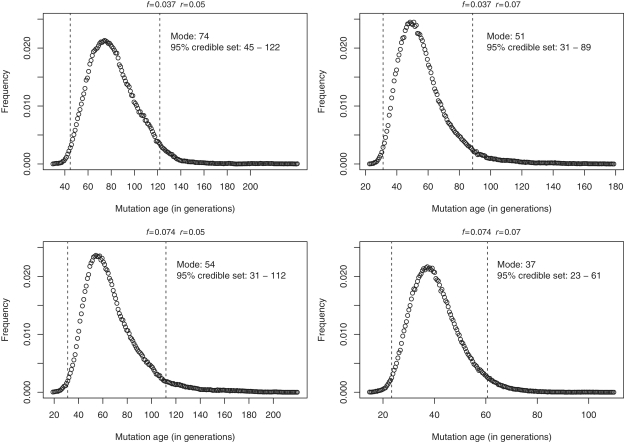
Figure 5.
Result from the DMLE analysis showing posterior probability density of the mutation age for different population growth rates (r = 0.05, r = 0.07) and different proportions of mutation bearing chromosomes sampled (f = 0.037, f = 0.074). The dashed lines correspond to the 95% credible set of values.

