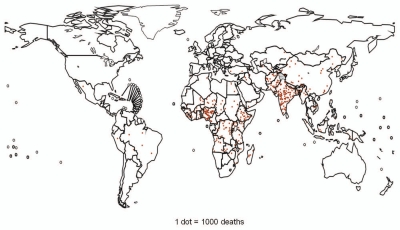
Figure 2.
Estimated distribution of rotavirus deaths among children <5 y of age. Each dot represents 1,000 deaths. Dots are placed at random within each country according to the estimated number of deaths in that country. Adapted from Parashar UD, et al.1

