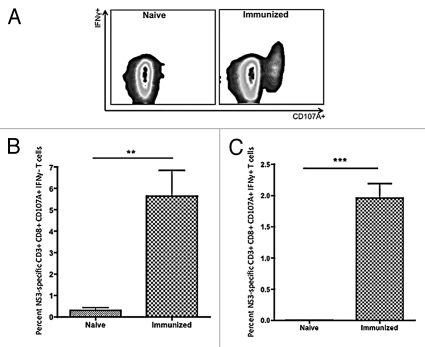
Figure 2.
Flow cytometric analysis of HCV NS3-specific CD8+ T cells for CD107A and IFNγ expression. (A) Representative HCV NS3-specific CD8+ T cell staining for CD107A and IFNγ. (B) Average percentage of HCV NS3-specific CD8+ CD107A+ IFNγ− T cells. (C) Average percentage of HCV NS3-specific CD8+ CD107A+ IFNγ+ T cells. Significance was determined by Student's t-test (*p < 0.05, **p < 0.005 and ***p < 0.0005; NS, not significant). (n = 5).

