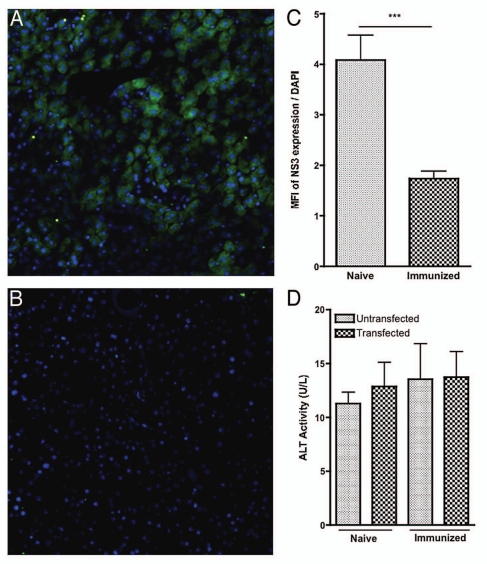
Figure 6.
Intrahepatic HCV NS3-specific cytotoxic T-cell responses within the liver following HCV NS3 transfection. Intrahepatic HCV NS3-specific cytotoxic T-cell responses within the liver following HCV NS3 transfection. (A and B) Confocal microscopy. Expression of HCV NS3 was detected with an anti-HA antibody (green). Nuclei were stained with DAPI (blue). (A) Representative liver confocal images of hepatocyte expression of HCV NS3 in the (A) naïve group (B) immunized group. (C) Average MFI ratio of expression of HCV NS3 as normalized to DAPI. For each group, four images were captured for each animal (n = 4, one animal from each group was dropped due to insufficient sample quality). MFI values for HCV NS3 were calculated and normalized to the MFI value for DAP I for each image. (D) Average ALT activity before and after liver transfection of each group. Significance was determined by Student's t-test (*p < 0.05, **p < 0.005 and ***p < 0.0005).

