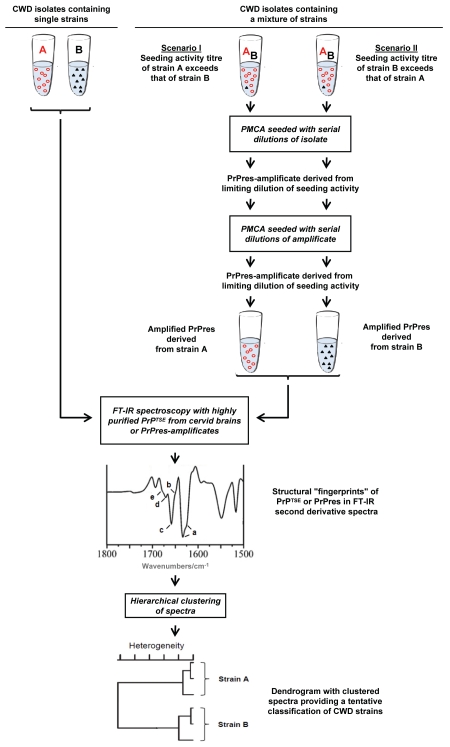
Figure 1.
Typing of CWD agents by FT-IR spectroscopy of strain-related misfolded prion protein. Unknown CWD field isolates may contain single or multiple strains of agent. For the typing of CWD agents by FT-IR spectroscopy purified PrPTSE from cervids affected with a single strain only could be directly examined. However, mixtures of distinct CWD agents would need to be separated into single strains prior to FT-IR spectroscopic analysis. Perspectively, this may be achieved by PMCA repeatedly performed with limiting dilutions of CWD seeding activity (limiting dilutions would be identified as the highest dilutions of CWD test samples that still show a detectable seeding activity, i.e., formation of PrPres). If a test sample contained two CWD strains, A and B, and the seeding activity of strain A exceeded that of strain B under specific PMCA conditions, PMCA performed with limiting dilutions should selectively amplify PrPres derived from strain A. Vice versa, PrPres derived from strain B should be selectively amplified if the seeding activity of this strain exceeded that of strain A. Thus, amplification of PrPres from the CWD strain with the relatively highest seeding activity should be achieved by the depicted analytical approach. It has to be noted that the relative seeding activities of different strains in a given CWD isolate (1) do not need to quantitatively correlate with the relative amounts of their respective PrPTSE and (2) may depend on the specific PMCA conditions used for PrPres amplification. Therefore, if aliquots of a CWD isolate were processed under differing PMCA conditions favoring the amplification of PrPres from different strains, this could potentially allow the isolation of PrPres amplificates from two or more CWD strains in the sample. Once highly purified PrPTSE extracts or PrPres amplificates have been prepared, these can be subjected to FT-IR spectroscopy. The obtained spectral information comprised in the amide I absorption band between about 1,600–1,700 wavenumbers/cm should provide a structural fingerprint of β-sheets (low frequency, a), unassigned structure (b), α-helices (c), turns (d) and turns/β-sheets (high frequency, e) of the examined PrPTSE/PrPres as shown in the FT-IR second derivative spectrum of the figure. This spectral information can be used as input data for a hierarchical cluster analysis in order to obtain an objective sample classification in terms of tentative CWD strain assignments.26,34 Abbreviations: A, CWD strain A; B, CWD strain B. Symbols: circles, misfolded prion protein associated with or PMCA-derived from CWD strain A; triangles, misfolded prion protein associated with or PMCA-derived from CWD strain B.

