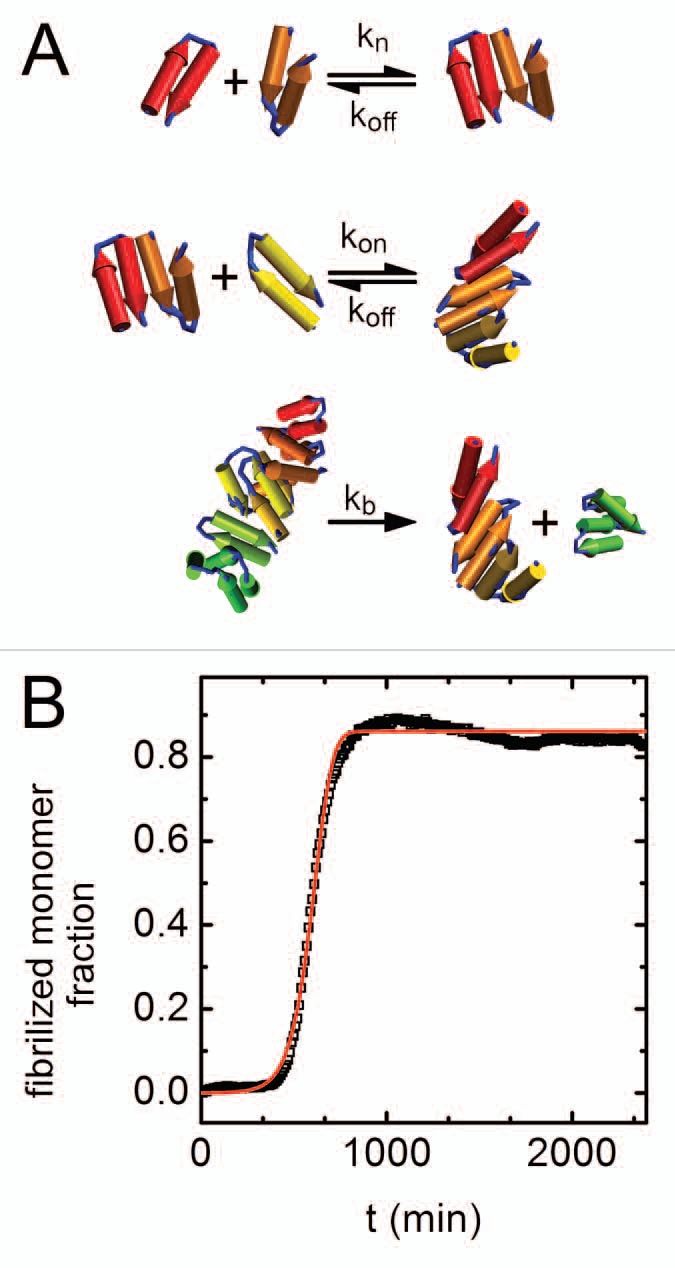
Figure 2.

Kinetics of amyloid aggregation. (A) A schematic representation of the steps in the kinetic scheme used to fit the data. The mechanism involves reversible nucleation, reversible monomer-fibril association, and fibril fragmentation steps. (B) Fibrilized monomer fraction as a function of time (black squares) with an overlaid optimized fit to the kinetic model (red line). The fibrilized monomer fraction relates to the fluorescence signal (Fig. 1A) by selecting the highest fluorescence signal in the entire data set (found for the highest concentration of sorbitol) and assuming that value is the fluorescence signal for a fully fibrilized sample.
