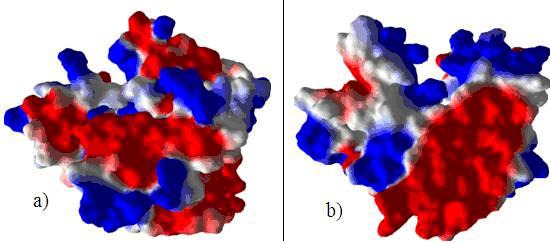
Figure 2.

(a) and (b) Argus lab [15] representation of the electrostatic surface potentials of M. incognita GST showing the highly acidic and basic regions of the protein (a) and a view of the same molecule turned 180 about the x axis (b). The negative potential (colored red) and the positive potential (colored blue) respectively.
