
Figure 3.
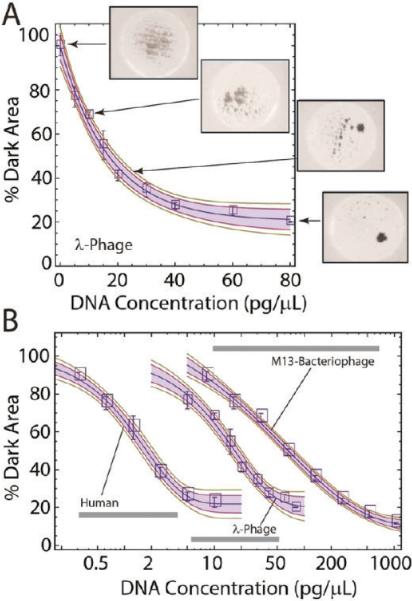
The pinwheel effect allows for quantification of DNA and cell counting. (A) Calibration curve illustrating the relationship between the mass of prepurified DNA and the extent of pinwheel formation (% Dark Area). The solid line represents a stretched exponential calibration function fitted to the data; the shaded area and green lines show the 95% and 90% confidence regions for this fit. (B) Pinwheel calibration curves for DNA from bacteriophage M13 (size 6.4 kbp), lambda phage DNA (48.5 kbp), and DNA in human whole blood (~100 kbp).