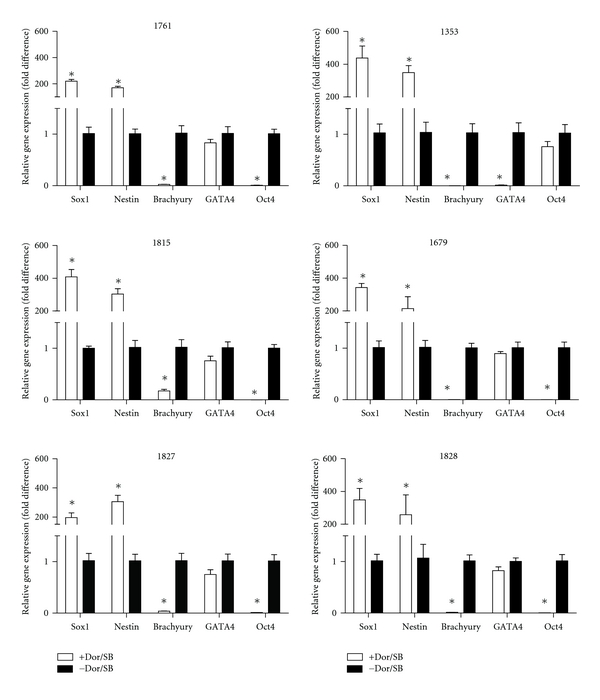
Figure 4.

Quantitative gene expression analysis of PD and control lines with and without Dor/SB. Expression levels of neuroectoderm (Sox1 and Nestin), mesoderm (Brachyury), endoderm (GATA4), and pluripotent markers (Oct4) were assessed by quantitative PCR. The y-axis represents means + SEM of relative expression levels of each gene in the EBs with Dor/SB relative to no Dor/SB treatment (*P < 0.01). Left panel depicts lines from healthy donors; right panels depicts cell lines derived from patients with PD. Data are presented as mean + SEM compared to the controls (n = 3, except 1679, n = 2). P-value of each study was assessed by one-way ANOVA along with Newman-Keuls post-hoc analysis.
