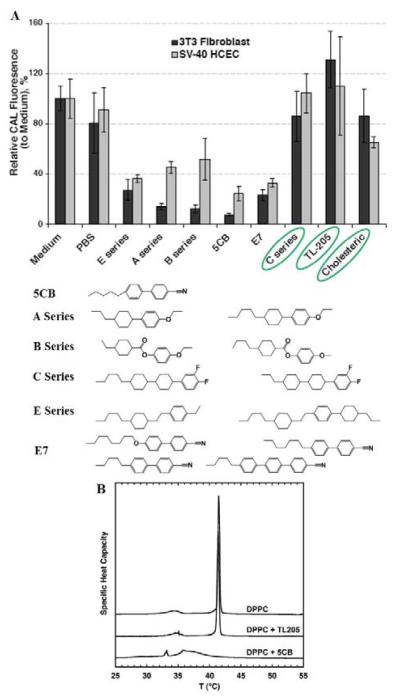
Figure 10.
(A) Relative intensities of fluorescence from CAL-AM added to 3T3 fibroblasts (black bars) and SV-40 HCECs (grey bars) after treatment of the cells with each LC indicated below the plot. The CAL fluorescence indicates the presence of living cells. (B) DSC endotherms of DPPC multilamellar vesicle suspensions following seven days of incubation at 37 °C in the absence or presence of either TL205 or 5CB. Reproduced with permission from ref 75 and ref 76 (Taylor & Francis Group).

