
Figure 1.
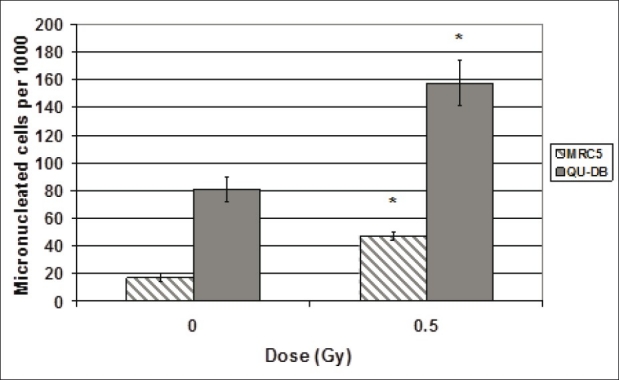
Frequency of cells containing micronuclei per 1000 binucleated cells of QU-DB and MRC5 cells irradiated with 0 (spontaneous MC) and 0.5 Gy. Values represent mean of at least five independent experiments ± SD. *P < 0.001 indicates significant difference between spontaneous and 0.5 Gy irradiated cells