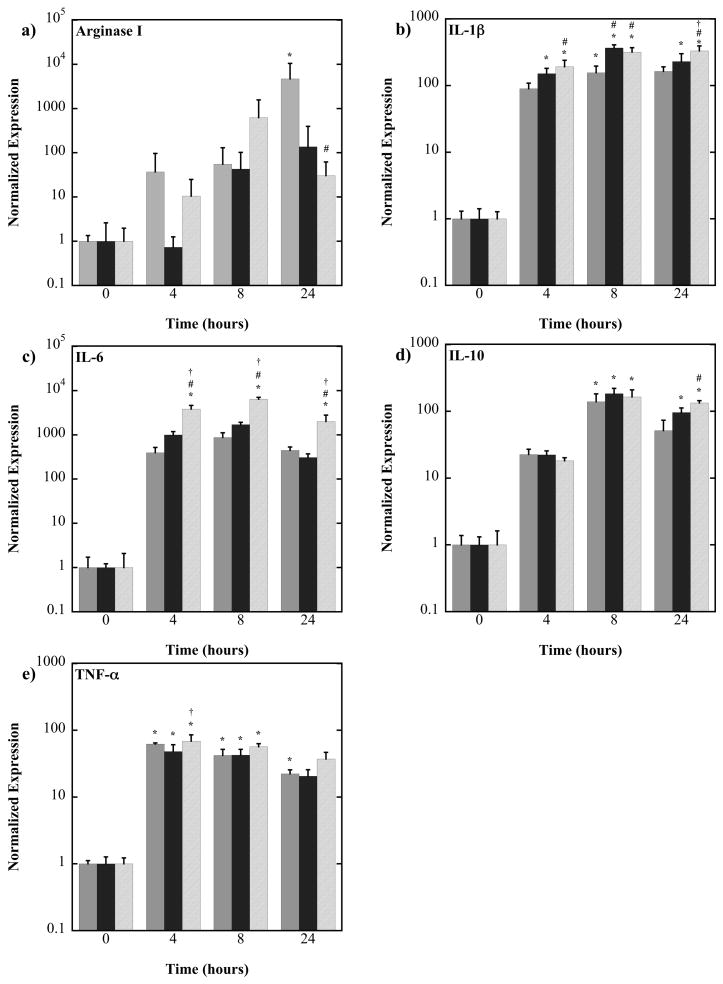
Figure 3.
Normalized gene expression of murine bone marrow-derived primary macrophages cultured on 130 (light gray), 240 (dark gray) and 840 (hash mark) kPa PEG-RGD hydrogels in the presence of lipopolysaccharide. Gene expression was normalized to the zero hour time point for each gel stiffness. *above a bar indicate significance from the 0 hour time point of the same gel stiffness, # indicates significance from the 130 kPa hydrogel at the same time point, and † indicates significance from the 240 kPa hydrogel at the same time, p<0.05. Note that plots are on a log scale. (n=4).

