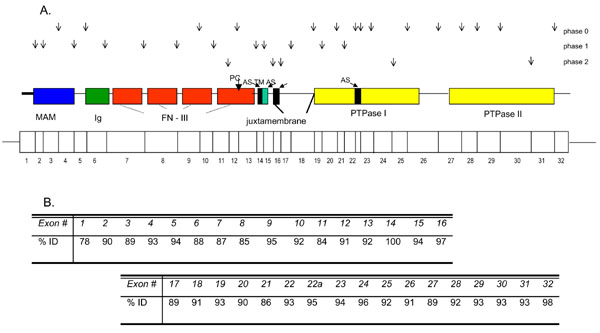
Figure 3.
A. Relationship between RPTPρ protein domains, corresponding exons and associated intron phases. Downward arrows indicate intron phases. Protein domains (center) show good correspondence with exon boundaries (bottom line). B. Percentage nucleotide identity between human and mouse exons. The percentage identity between human and mouse exons was calculated by dividing the number of mismatched nucleotides by the total length of the exon. AS, alternative splice site; FN-III, fibronectin type III repeats; Ig, immunoglobulin-like domain; MAM, meprin/A5/μ domain; PC, proteolytic cleavage site; PTPase I and II, protein tyrosine phosphatase domains; TM, transmembrane domain.

