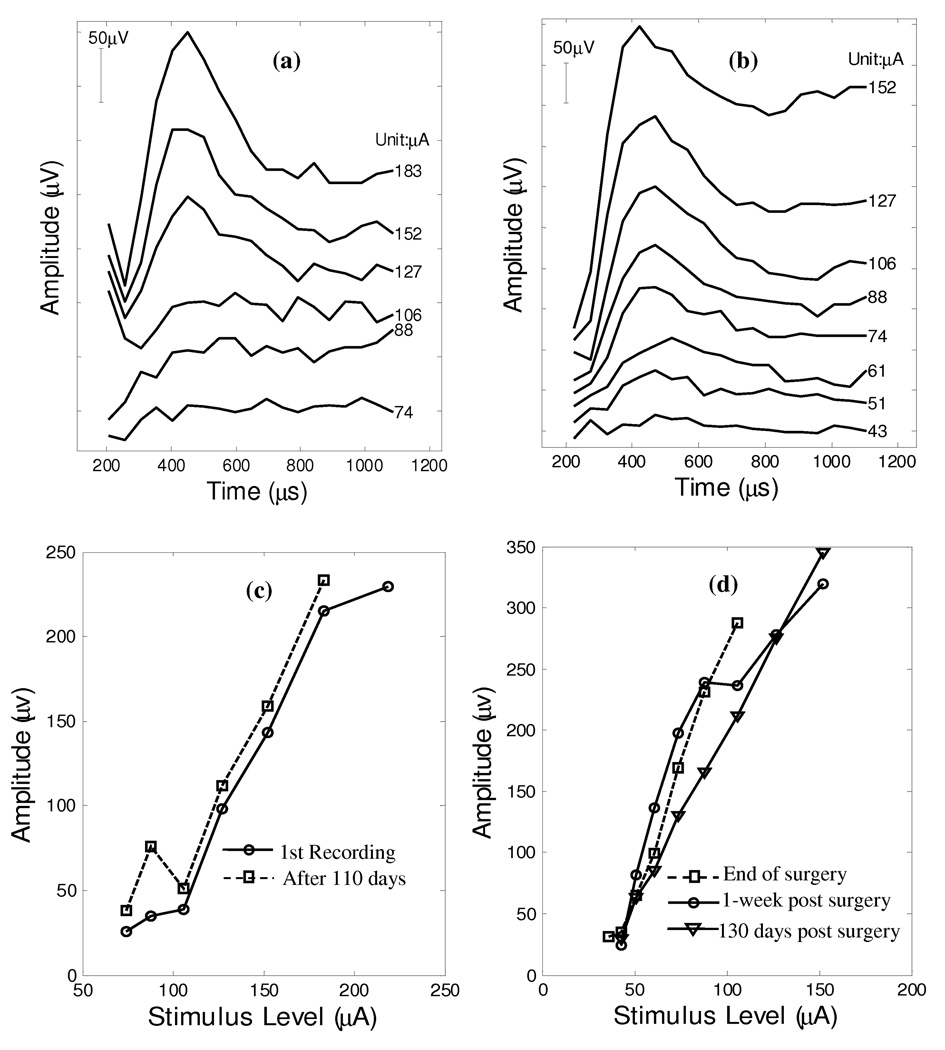
Figure 7.
ECAP recordings were repeated on monkey A (Panel a) 110 days past the initial collection and on monkey B (Panel b) 130 days post surgery. The 110-day N1-P1 amplitude growth function of monkey A is plotted on Panel c (□) together with a replot of the growth function from the 1st trial (○) (Figure 2). Similarly, Panel d shows the N1-P1 amplitude growth function of ECAPs collected at various periods; i.e., immediately following implantation surgery (□), 1-week post surgery (○), 130 days post surgery (▽).

