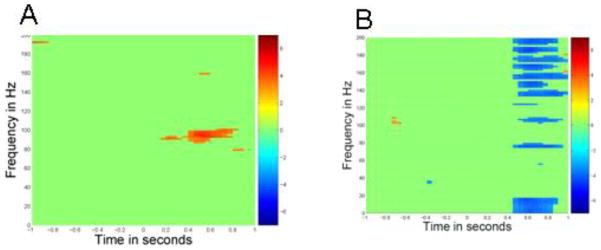
Figure 4.
Thresholded (p<.001) time frequency spectrogram of average left medial temporal response to viewing negative (frightened) face pictures. Faces are presented at time 0. Post-stimulus activity is compared statistically to a pre-stimulus baseline. 4A. Subject #1, a representative psychiatrically healthy patient, shows expected increased gamma (80–100 Hz) activity .2 – .8 seconds after negative face presentation. 4B. Subject #2, a patient with schizophrenia-like psychosis of epilepsy and chronic paranoia, shows decreased gamma and high-gamma activity following stimulus presentation, suggesting aberrant medial temporal response to threat.

