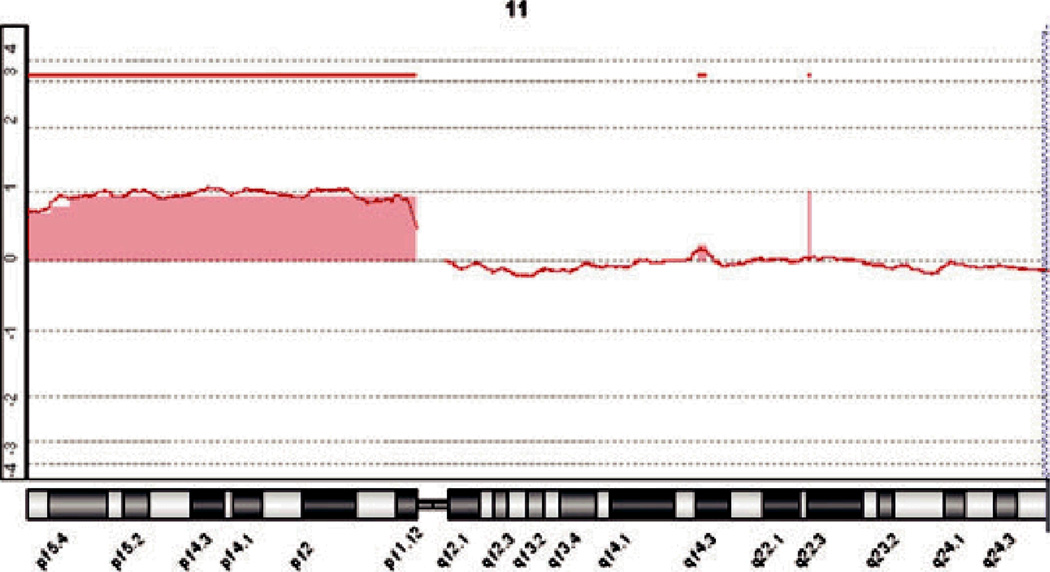
Fig. 1.
A tracing from aCGH analysis shows clear gain in signal at the position of chromosome 11p. The remainder of the genome showed little variation from baseline. (The above graph shows the log2 of the ratios of the fluorescence intensity of the hybridized tumor-derived DNA and that of a differentially-labeled normal reference genome along chromosome 11 on the x-axis. A log2 ratio of 0 represents normal copy number.)

