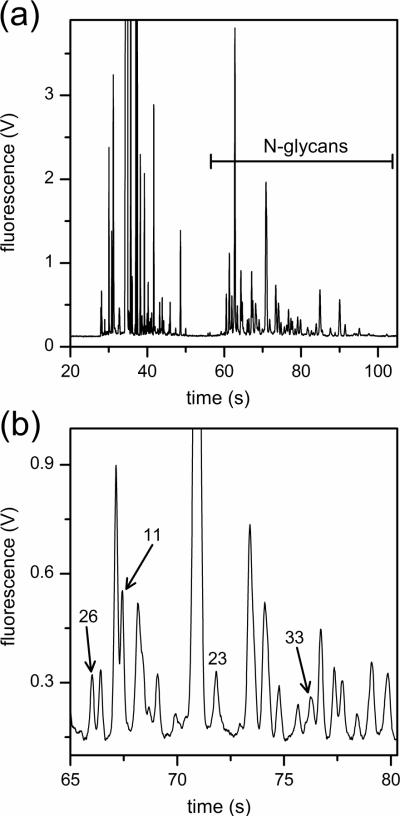
Figure 2.
(a) Electropherogram of a native N-glycan sample derived from the blood serum of a patient with esophageal adenocarcinoma. N-glycans with migration times from 55 to 110 s are used for the disease-state analysis. (b) Expanded region of the electropherogram in panel (a) with peaks 11, 23, 26, and 33 labeled. The electric field strength is 1250 V/cm, the separation length is 22 cm, and the N-glycans are labeled with 8-aminopyrene-1,3,6-trisulfonic acid (APTS).

