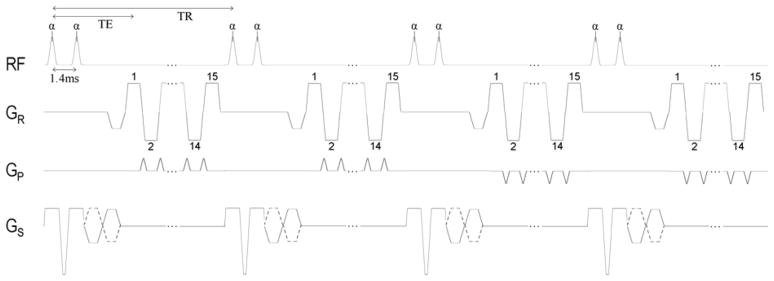
Figure 2.
Pulse sequence diagram illustrating details of the segmented EPI acquisition with velocity encoding on the slice-select gradient axis. Center-out encoding is used for every echo train. The diagram accurately depicts the sequence timing used in this study, although only 2 of the 4 shots used for each image are shown. Echo train length of 15, 4 shots per image, and TGRAPPA acceleration factor of 2 resulted in 120 reconstructed lines.

