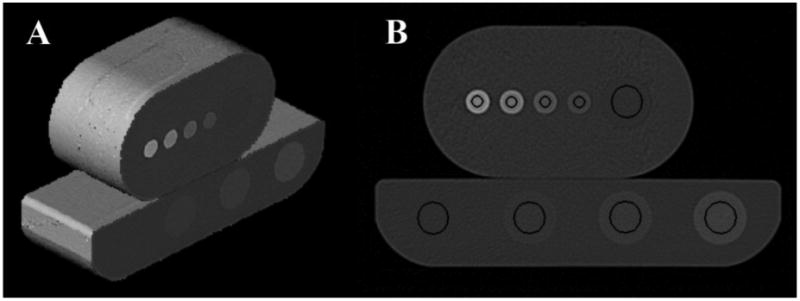
Figure 1.

Image Analysis calibration phantom (bottom) and medium-sized foot phantom with QRM inserts (top) are illustrated. A. shows a 3D rendering of the scanned portions. B. shows a cross-section through both phantoms and the circular regions of interest (black) for that slice that were used to measure attenuation in HUs. The ROI to the far left in the IA calibration phantom (bottom) is the “water” reference.
