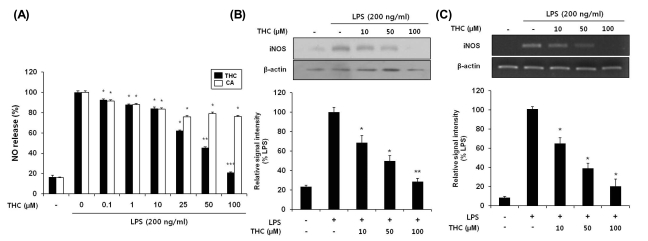
Fig. 2.
THC inhibited NO production (A) and expression levels of iNOS protein (B) and mRNA (C) in LPS-stimulated BV2 microglial cells. (A) BV2 cells were pretreated with various concentrations of THC for 1 hr before incubation with LPS (200 ng/ml) for 24 hr. The amounts of nitrite in the supernatants were measured using Griess reagent. THC exhibited a significant suppression of LPS- induced NO production in a concentration-dependent manner. (B) The cell lysates were subjected to SDS-PAGE, and then protein levels of iNOS were determined by Western blot analysis. (C) After LPS treatment for 6 hr, total mRNA levels of iNOS were examined by RT-PCR. The β-actin was used as an internal control. Quantification of iNOS production was performed by densitometric analysis (lower). THC significantly suppressed LPS-induced iNOS expression in a concentration-dependent manner. The data are expressed as mean±S.D. (n=3), and are representative of three or more independent experiments. *p<0.05, **p<0.01 and ***p<0.001 indicate statistically significant differences from treatment with LPS alone.

