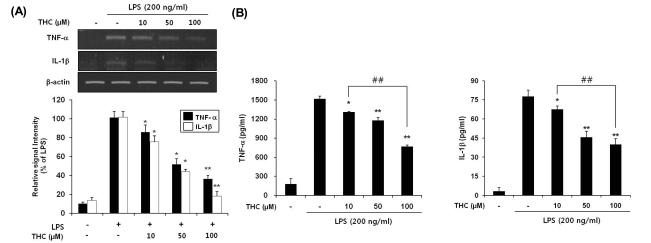
Fig. 3.
THC inhibited gene expression (A) and release (B) of TNF-α and IL-1β in LPS-stimulated BV2 microglial cells. (A) BV2 microglia cells were pretreated with the indicated concentrations of THC for 1 hr before LPS treatment (200 ng/ml), and total RNA was isolated at 6 hr after LPS treatment and mRNA levels were determined by RT-PCR analysis. THC significantly suppressed expression of TNF-α and IL-1β. Data from triplicate determination are shown (mean±SD). (B) Cell culture media were collected and subjected to TNF-α and IL-1β ELISA. Data represent three independent experiments in triplicate and are expressed as mean±SD. *p<0.05 and **p<0.01 indicate statistically significant differences from treatment with LPS alone. ##p<0.01 indicates statistically significant differences between indicated groups.

