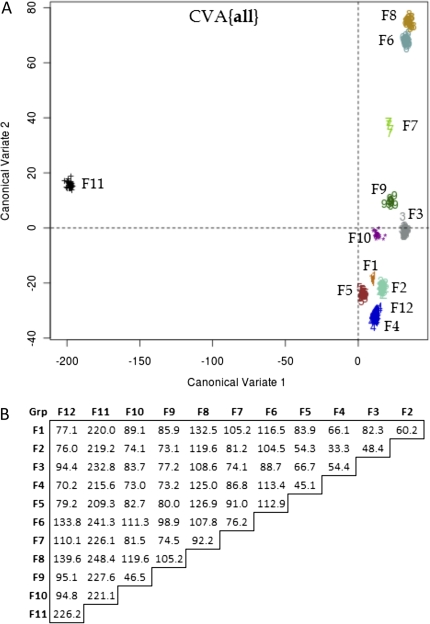
FIG. 5.
CVA of fungal bHLH groups. (A) Projection of 488 fungal bHLH sequences onto eigenvectors (CVs) for the all data set. Plot contains the first and second CV of 11 total. Axes reflect the Mahalanobis distance between fungal groups F1–F12. Group F12 is not discernable from Group F4 with only the first and second CVs. (B) Pairwise Mahalanobis distance between fungal group centroids in the CVA{all} analysis.

