Figure 4.

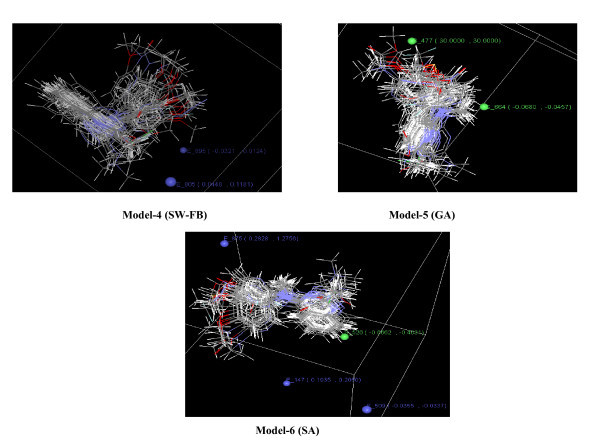
Contour plots of 3D-QSAR models (4-6) with important steric and electrostatic points contributing to the models with range of values shown in parenthesis.

Contour plots of 3D-QSAR models (4-6) with important steric and electrostatic points contributing to the models with range of values shown in parenthesis.