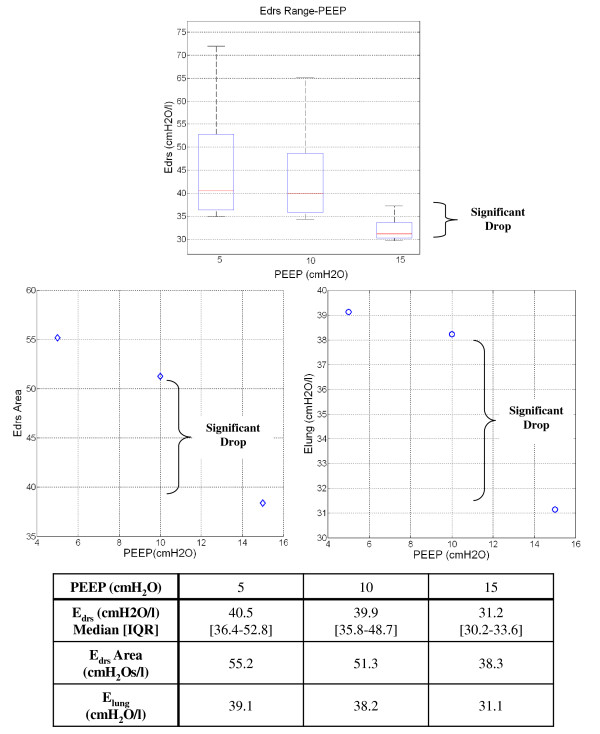
Figure 5.
Patient 9 Edrs, Edrs Area and Elung change with PEEP. Top Panel: Box-and-whisker diagram for Patient 9 Edrs when PEEP increase from 5 to 10cmH2O. The Edrs drops significantly when PEEP is increase from 10 to 15cmH2O. Bottom Left Panel: Edrs Area-PEEP plot for Patient 9. Bottom Right Panel: Elung-PEEP for Patient 9.

