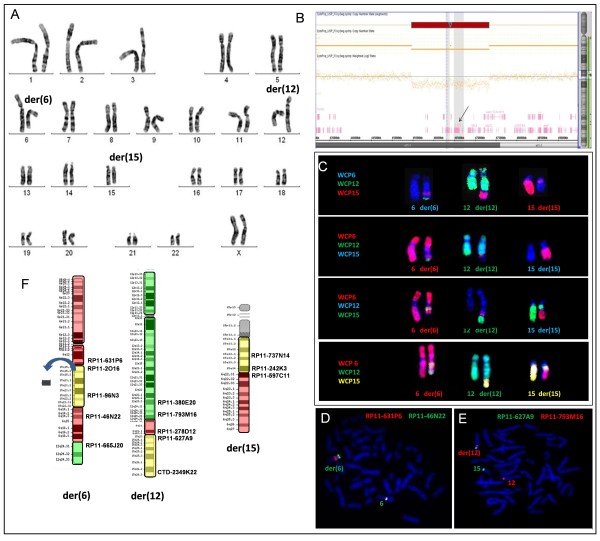
Figure 2.
Cytogenetic and molecular data from the patient studied. A) GTG-banded chromosomes showing the translocation involving chromosomes 6, 12 and 15. B) Array result for chromosome 15 showing the 1.9 Mb deletion (red) at 15q21.1 including the FBN1 gene (arrow). C) FISH with WCP probes of chromosomes 6, 12 and 15 in different color combinations showing a complex chromosomal rearrangement. D) FISH with probes RP11-631P6 (6q13) in red and RP11-46N22 (6q14.3) in green, showing signals next to each other on the normal chromosome 6 and separate signals on the der (6) chromosome. E) FISH with probes RPRP11-627A9 (15q23) in green and RP11-793M16 (12q24.13) in red, showing signals of both on the derivative chromosome 12. F) Ideogram of the derivative chromosomes involved in the patient's complex chromosome rearrangement, showing the probes used to define the breakpoints and the 15q21.1 band deletion (arrow).

