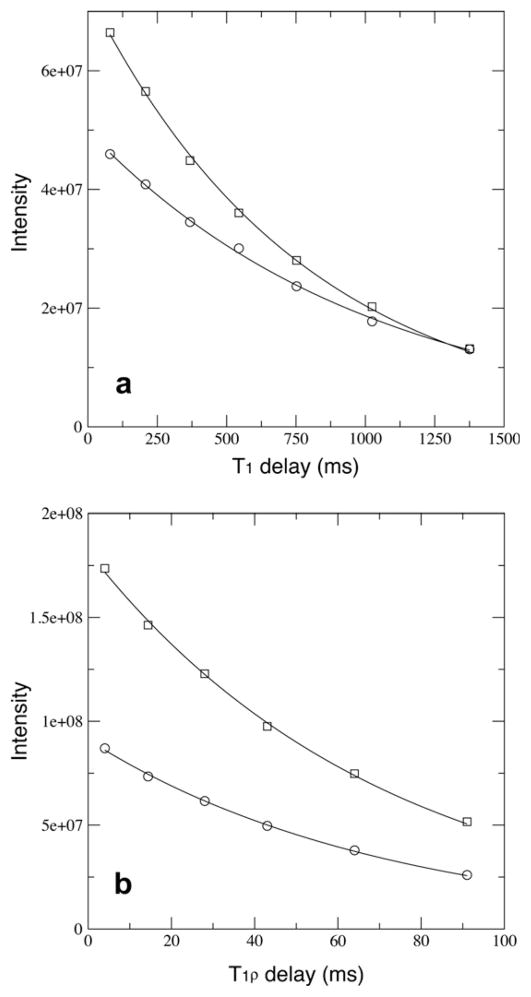
Fig. 3.
The T1 (a) and T1ρ (b) relaxations curves for a buried residue A96 with absolute intensities being plotted. Data points from the dephase and the flip-back measurements are shown in squares and circles, respectively. The fit relaxation time constants in (a) are 1019 ms and 783.0 ms for the dephase and the flip-back measurements, respectively. The fit relaxation times constants in (b) are 71.94 ms and 71.15 ms for the dephase and the flip-back measurements, respectively.

